Technical SEO
Core Web Vitals Improvement
Three metrics: LCP under 2.5s, INP under 200ms, CLS under 0.1
- Timeline
- Fixes typically ship over 5 to 8 weeks
Call (714) 823-3164 or ask a question. Clear recommendations, even if we never work together.
Core Web Vitals improvement targets the three page experience metrics Google measures on real visits. Those three are largest contentful paint, interaction to next paint, and cumulative layout shift. The work follows field data from the Chrome User Experience Report, not lab scores. Field data is what Google actually uses.
The problem
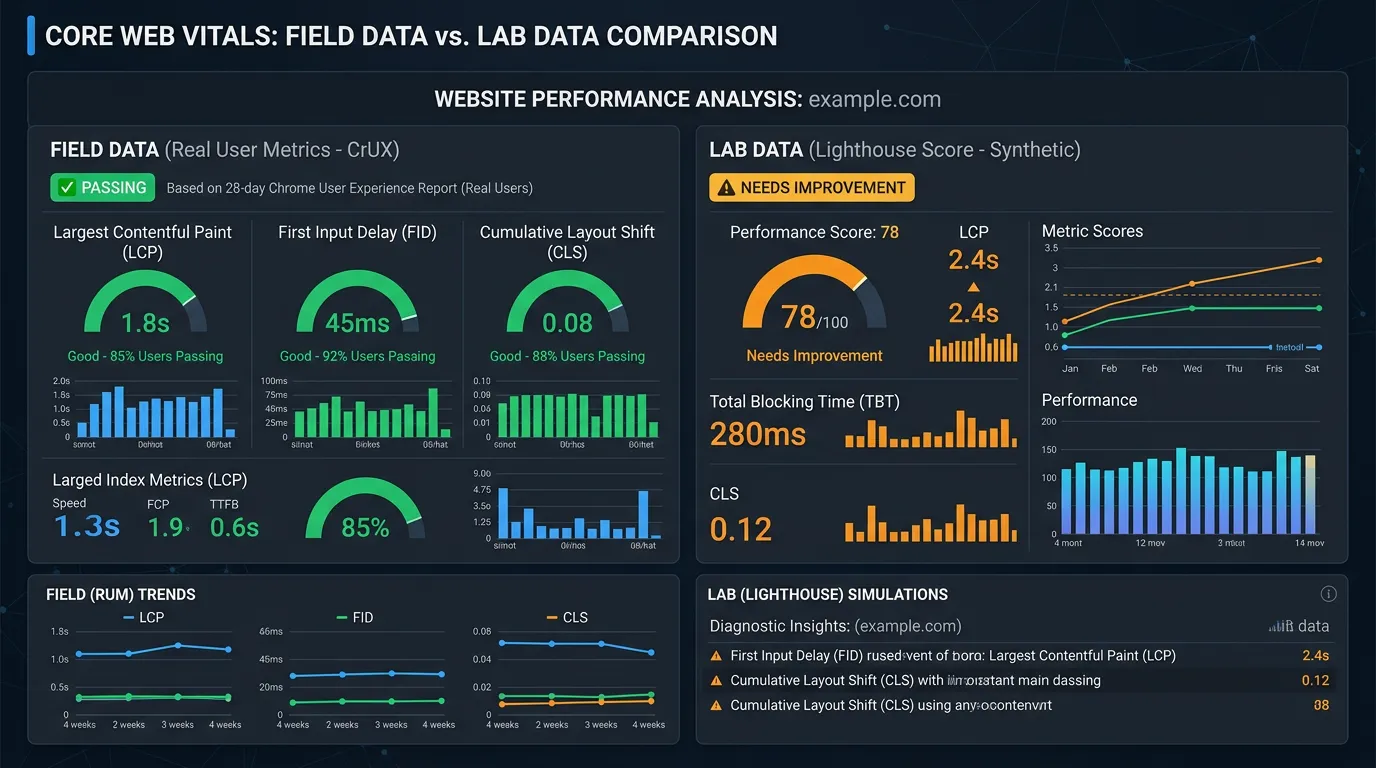
Owners run PageSpeed Insights, see a green 92, and assume the page experience box is checked. Then Search Console reports the URL group as failing Core Web Vitals. The confusion is that the score at the bottom of the report is lab data from a simulated device, while the section at the top is field data from real Chrome users on real phones and real networks. Google uses the field data. A page can score well in the lab and still fail in the field because actual visitors use older phones on congested networks, or because a chat widget loads two seconds in and shoves the whole layout down.
What it is
Each of the three metrics has its own causes and its own fixes. Largest contentful paint is usually slow for one of three reasons. It can be server response time, a hero image nobody optimized, or a font or script blocking the render. Interaction to next paint measures how fast the page responds when someone taps something. Long tasks from heavy JavaScript are the usual cause there, especially third party tags and chat widgets. Cumulative layout shift comes from images and ads with no reserved space. It also comes from fonts swapping in late and from elements dropped in above existing content. We diagnose each metric on its own. We use the CrUX field report, the Search Console Core Web Vitals report, and Chrome DevTools performance traces. Then we fix the specific cause instead of running a generic speed checklist.
Signs you need this
- Search Console shows URL groups failing Core Web Vitals on mobile
- PageSpeed shows a good score but the field data section says poor
- Your page visibly jumps around while it loads
- Tapping a button on mobile feels delayed before anything happens
- A chat or review widget loads late and pushes content down the page
What is included
- Field data breakdown by metric and URL group from CrUX
- Search Console Core Web Vitals report interpretation
- LCP element identification and optimization per template
- Long task reduction and JavaScript execution cleanup for INP
- Dimension reservation and font loading fixes for CLS
- Third party script impact measurement with load order changes
- Chrome DevTools performance traces before and after
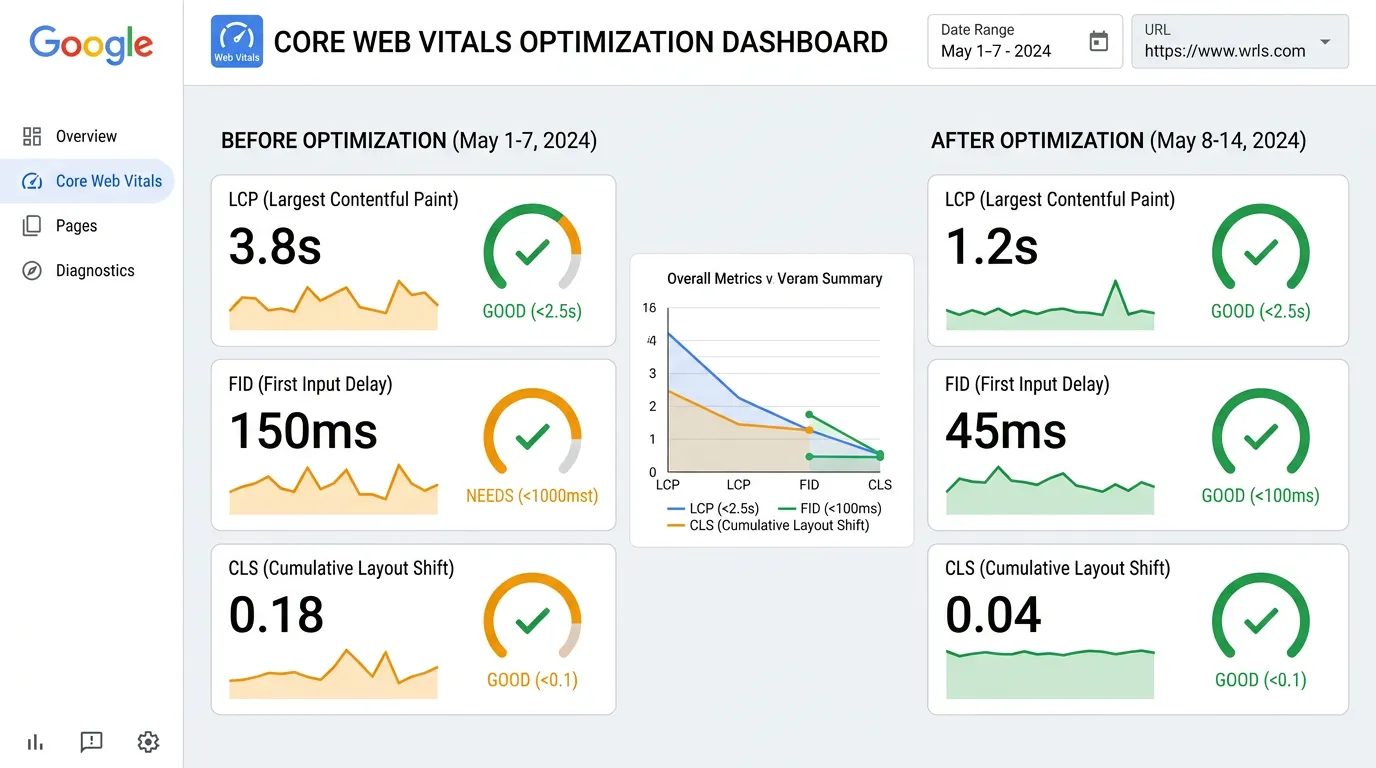
- 28 day tracking chart showing field data movement
Our process
Field data diagnosis
Week 1We pull the CrUX report and the Search Console Core Web Vitals report to see which URL groups fail, on which metric, and on which device type. Failing on mobile only is a very different problem from failing on both.
Per metric root cause
Week 1 to 3For each failing metric we identify the actual element or script responsible using DevTools performance traces on a throttled CPU profile. LCP gets an element name, INP gets a specific long task, CLS gets a specific shifting node.
Targeted fixes
Week 3 to 7Hero images get preloaded and sized, heavy scripts get deferred or replaced, chat and review widgets get delayed until interaction, and every image, embed, and ad slot gets explicit dimensions so nothing jumps.
Lab verification
Week 5 to 8Each change gets verified in Lighthouse and DevTools before deployment, so we know the mechanism worked even before field data catches up. Lab confirms cause and effect. Field confirms real world impact.
Field data watch
Week 6 to 16We track the 28 day rolling field data weekly and report movement. If a metric does not respond as expected, we go back to the trace rather than piling on more generic fixes.
Realistic timeline: Fixes typically ship over 5 to 8 weeks. Field data updates on a rolling 28 day window, so the earliest honest read on whether a URL group moved into the passing range is about 4 weeks after the last change, and 8 to 12 weeks for a stable read.
The Add Ons That Usually Break Each Metric
Third party code causes most Core Web Vitals failures on small sites. Here is what breaks, which metric it hits, and the lighter option.
| Add on | Metric it hurts | Why it hurts | Lighter option |
|---|---|---|---|
| Live chat widget | INP and CLS | Loads early, runs scripts, pushes content down | Load it after the first tap or scroll |
| Review carousel | LCP and CLS | Pulls reviews in late, then resizes the box | Print reviews into the page, refresh nightly |
| Tag manager stack | INP | Every tag adds work on the main thread | Audit tags twice a year, delete the dead ones |
| Map embed | LCP and INP | Loads a full map library on every visit | A static map image that links out to Maps |
| Video embed | LCP and INP | The player loads whether or not it is played | A thumbnail that loads the player on click |
| Homepage slider | LCP and CLS | Several large images, only one gets seen | One image and no slider at all |
| Web font set | LCP and CLS | Text waits, then swaps and reflows the page | Two weights, preloaded, with display swap |
Order removals by what each one earns you. A chat widget that books real jobs may be worth its cost.
INP Is the One That Catches People Out
Largest contentful paint and layout shift are about loading. Interaction to next paint is about what happens after, and it is measured on every tap, click, and key press during the visit, not just the first.
The cause is almost always JavaScript holding the main thread. A browser can only do one job at a time there. If a tracking script is busy for 300 milliseconds when someone taps your menu, the menu cannot open until that script finishes. The visitor taps again, which makes it worse.
The fixes are unglamorous. Cut the number of scripts. Delay anything not needed to use the page. Break long jobs into smaller ones so the browser can answer between them. On a typical WordPress site, removing two plugins does more for INP than any setting inside a caching tool.
Layout Shift Causes, in the Order to Rule Them Out
Cumulative layout shift is the cheapest of the three to fix. The causes are a short list, and each one is easy to see once you know to look.
Images with no width and height set
The browser reserves no room, so text jumps when the photo lands.
Ads or embeds in a box with no set height
Reserve the space even when the slot comes back empty.
Fonts that swap in after the page paints
Preload the font and match the fallback size closely.
Banners injected at the top of the page
Cookie bars and alerts shove everything down. Overlay instead.
Content added by script after load
Reviews, related posts, and forms all shift the page as they land.
A sticky header that shrinks on scroll
A small shift, repeated every visit, and counted every time.
Buttons that appear once JavaScript runs
Put them in the HTML and let the script attach the behavior.
More Core Web Vitals Questions
Are mobile and desktop scored separately?
What if my site has too little traffic for field data?
Does passing all three guarantee better rankings?