Results
Performance Metrics and Dashboards
This page explains exactly what we measure, where each number comes from, and what it can and cannot tell you. Nothing here requires you to take our word for it.
Call (714) 823-3164 or ask a question. Clear recommendations, even if we never work together.
Our dashboards report tracked calls, form fills, booked jobs, cost per lead, geogrid map visibility, and organic search performance. Each number names its source and its date. We show the limits of attribution instead of hiding them. You can see which figures are counted directly and which ones are estimates.
Any dashboard example shown in this section is labelled illustrative when it is a teaching example rather than a record of real work. Verified client reporting data is published here with dates and sources as clients approve them.
The Metrics That Matter
Most marketing reports are long because length looks like value. Ours are short because a report you actually read is worth more than a report you file. The metrics below are the ones that connect to money, arranged roughly in the order they matter to a service business owner. Everything else we track sits underneath these as supporting detail, available if you want it and out of your way if you do not. Notice what is missing. Impressions are not on the list. Neither is total website traffic, keyword count, or social followers. Those numbers move for reasons that have nothing to do with your revenue, and putting them at the top of a report trains everyone to celebrate the wrong things. If a supporting number ever explains a change in one of the metrics below, it shows up in the notes for that month with the explanation attached.
- Tracked calls by source, with duration so short misdials are excluded
- Form submissions and chats, with the page and source that produced them
- Booked jobs or appointments, when you share that data with us
- Cost per lead by channel, and cost per booked job where possible
- Geogrid map visibility across your service area over time
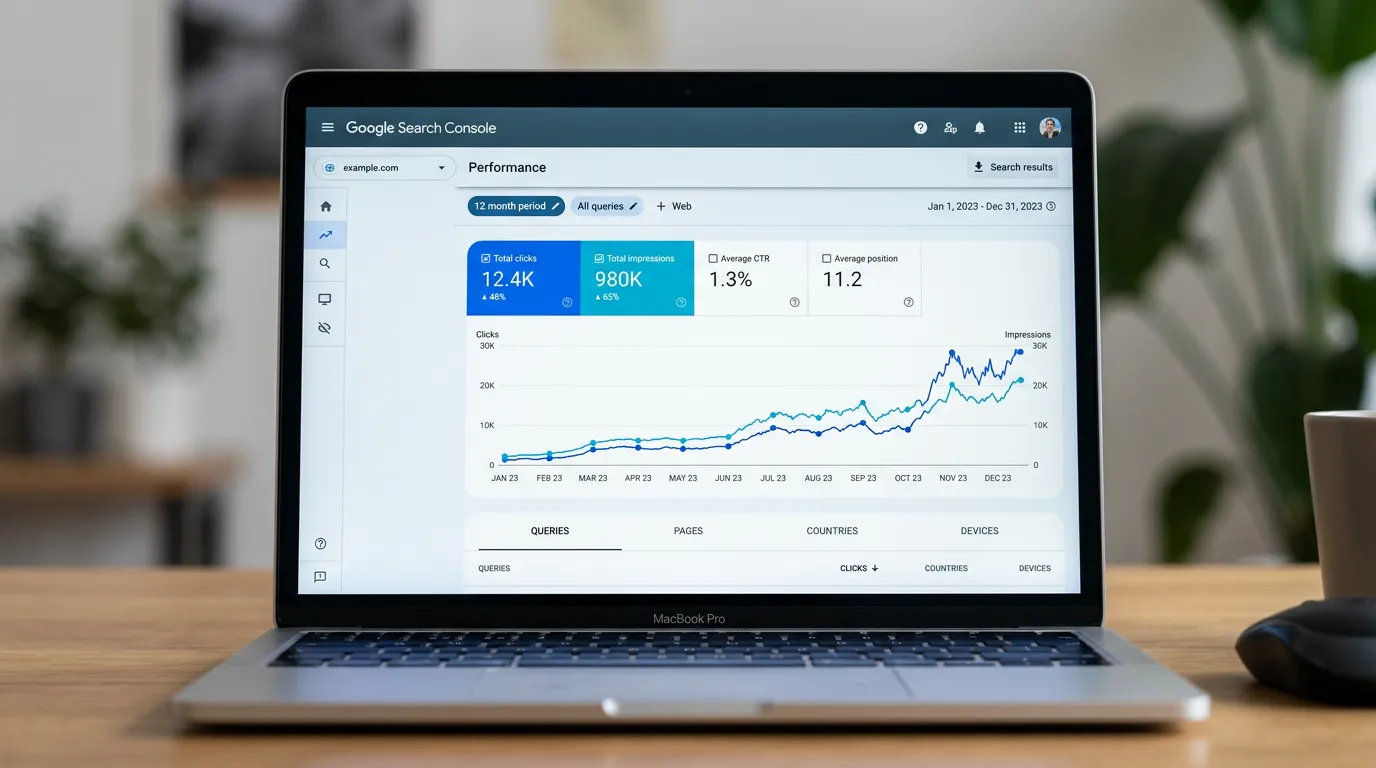
- Organic search clicks and impressions from Search Console, by page
- Review volume, rating, and how recent the newest reviews are
Where Each Number Comes From
Every figure on your dashboard names its source, because a number without a source is an opinion. Call data comes from a call tracking platform using dynamic number insertion, which swaps the phone number on your site based on how the visitor arrived. That is what lets us separate an organic search call from a paid ads call from a call placed directly on your Google profile. Google profile calls, direction requests, and profile views come from Google Business Profile itself. Organic clicks, impressions, and query data come from Search Console, which is Google reporting on its own results. Website behavior comes from your analytics property. Map visibility comes from the geogrid scanning tool with the scan settings recorded. Paid ads data comes from the ad platforms directly. Booked jobs come from you or your scheduling software, since we cannot see inside your operation. When two sources disagree, and they will, we show both numbers and explain the gap rather than picking the friendlier one and hoping you do not notice.
What Your Dashboard Shows
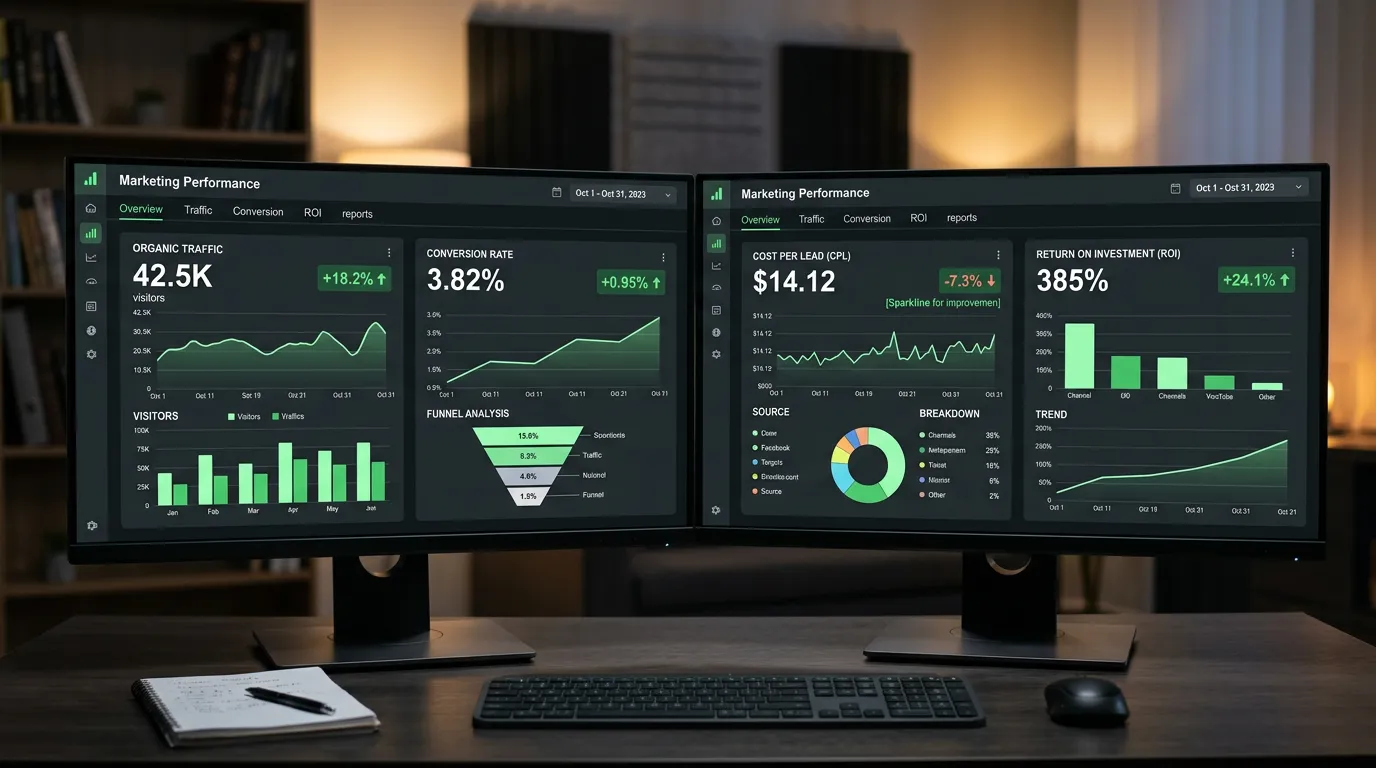
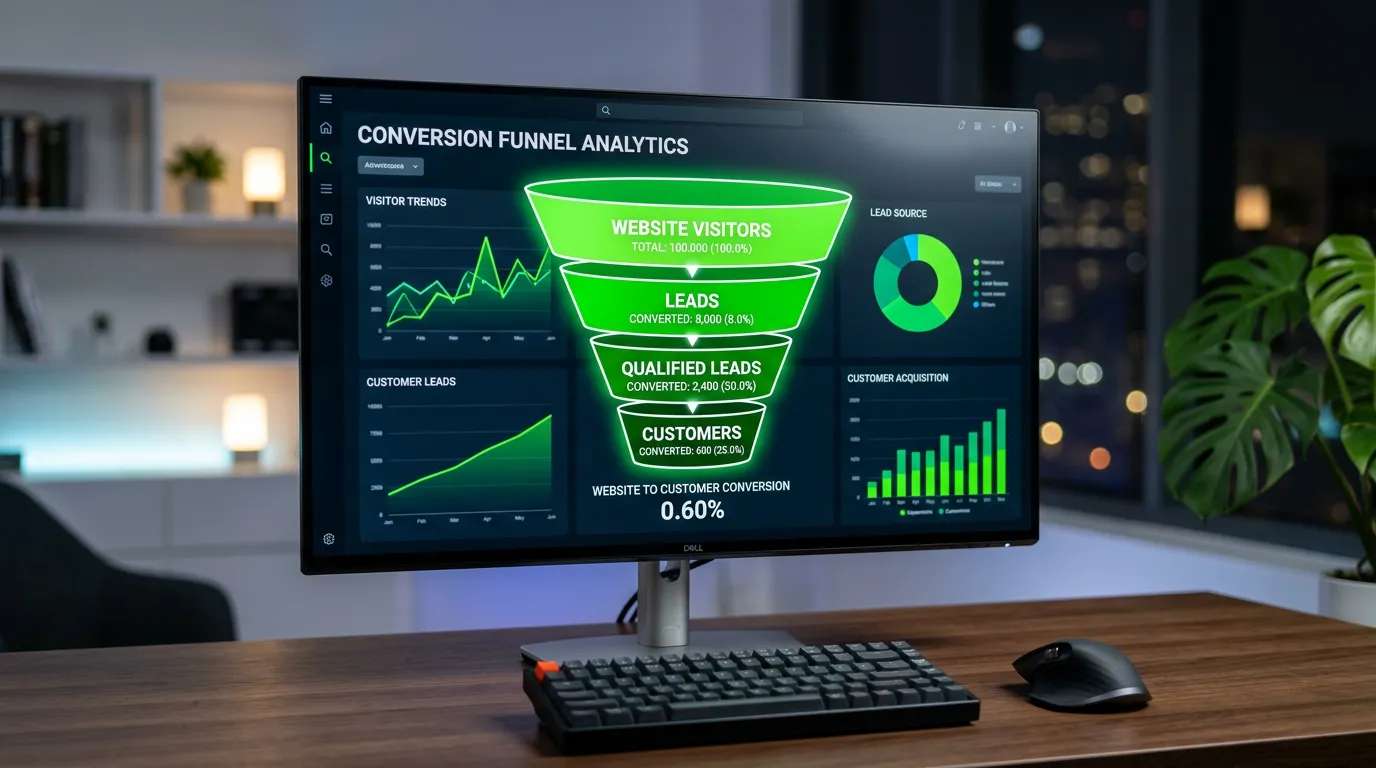
You get a live dashboard you can open any day of the month, not just a document that arrives when we choose to send one. The top section shows lead volume for the current period against the same period last year, which handles seasonality better than comparing to last month. Under that sits the channel breakdown, so you can see whether organic, paid, the Google profile, or direct traffic produced each lead. Then the map visibility view with the latest geogrid scan and the previous one side by side. Then the search performance detail by page and query. Call recordings sit in the call tracking platform with your own login, so you can listen to how your team handles leads without going through us. That last one is uncomfortable for some owners and it is often the most valuable thing in the whole system, because most of the recoverable money in a service business is in calls that were mishandled rather than calls that never happened.
The Limits of Attribution
Any agency that shows you perfect attribution is showing you a model, not a measurement. Real customer behavior does not cooperate. Someone sees your truck, searches your name a week later, reads reviews on a phone, then calls from a laptop three days after that. Tracking will credit the last step and miss the first one. Privacy protections, ad blockers, and browser rules on cross site tracking remove more of the trail every year. Offline conversations, referrals, and repeat customers never appear at all. Phone calls placed straight from a Google profile listing never touch your website, so no website tool sees them. We deal with this by being direct about which numbers are counted and which are estimated, by asking your team to add one question to their intake script, and by watching total lead volume alongside channel level data. If channel numbers look flat but total calls rose, something is working that the model cannot see. That is a normal finding, not a reporting failure, and pretending otherwise leads to cutting the channel that was quietly doing the metrics work.
How the Monthly Report Reads
The monthly report is short and follows the same shape every time, so you learn to read it in about four minutes. It opens with what happened: lead volume, how it compares to the same month last year, and the two or three things that most explain the difference. Then what we did, listed plainly, so you can see where the money went. Then what we found, which is usually the most useful part, because it covers the diagnostic work: a page that converts poorly, a city where visibility stalled, a run of unanswered calls, a competitor who added forty reviews. Then what is next, with the specific work planned for the coming month and why it comes first. In a bad month, the format does not change. We say the numbers fell, give the honest reason if we know it, say we are still investigating if we do not, and describe what we are changing. Then we talk it through on a call. A report that only makes sense in good months is a sales document.
Metric Definitions We Hold To
Most reporting arguments are really definition arguments. If a lead means one thing in January and another in September, the trend line is fiction. So we write the definitions down at the start of the engagement, agree on them with you, and keep them fixed unless we both decide to change one. When a definition does change, the report says so and shows the effect on the comparison. These are our defaults, and they can be adjusted to fit how your business actually works. A dental practice counting new patient calls needs a different rule than a roofer counting storm damage inquiries. What matters is not which rule we pick but that it stays the same long enough to mean something.
- A tracked call counts when it exceeds a set duration, so hangups are excluded
- A lead is a call or form from a person describing a real need, not a vendor or robocall
- First time callers are separated from repeat callers where the platform allows it
- Cost per lead uses ad spend plus the management fee for that channel, not spend alone
- Comparisons default to the same month last year, not the previous month
- Any definition change is noted in the report for the month it takes effect