Results
Before and After Rankings
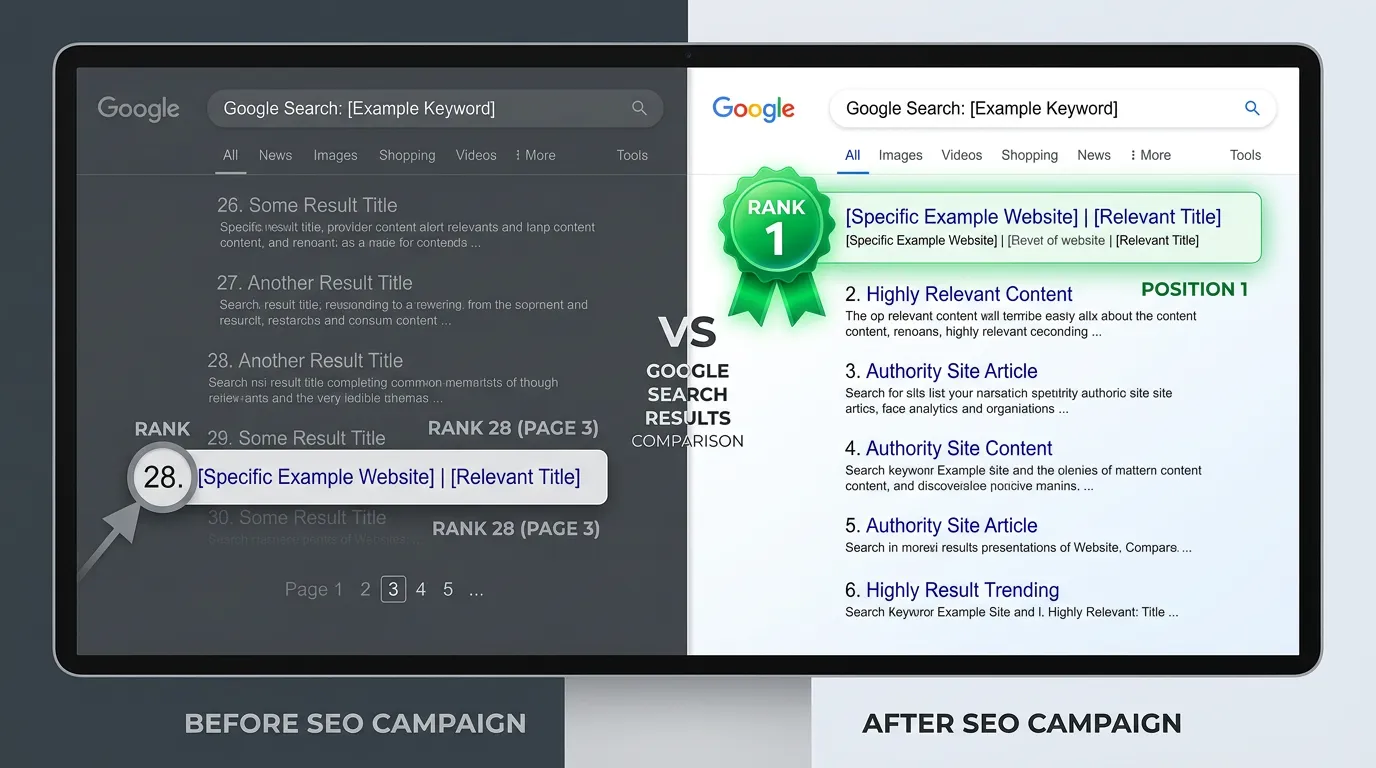
Ranking screenshots are the most common proof in this industry and the weakest. Here is what ranking data really shows, what it hides, and how we report it.
Call (714) 823-3164 or ask a question. Clear recommendations, even if we never work together.
Before and after ranking screenshots prove very little on their own. Google results change by location, device, and search history. A single screenshot is one snapshot from one place. Geogrid scans check many map coordinates, dated and repeated monthly. That is far better evidence of real local ranking change.
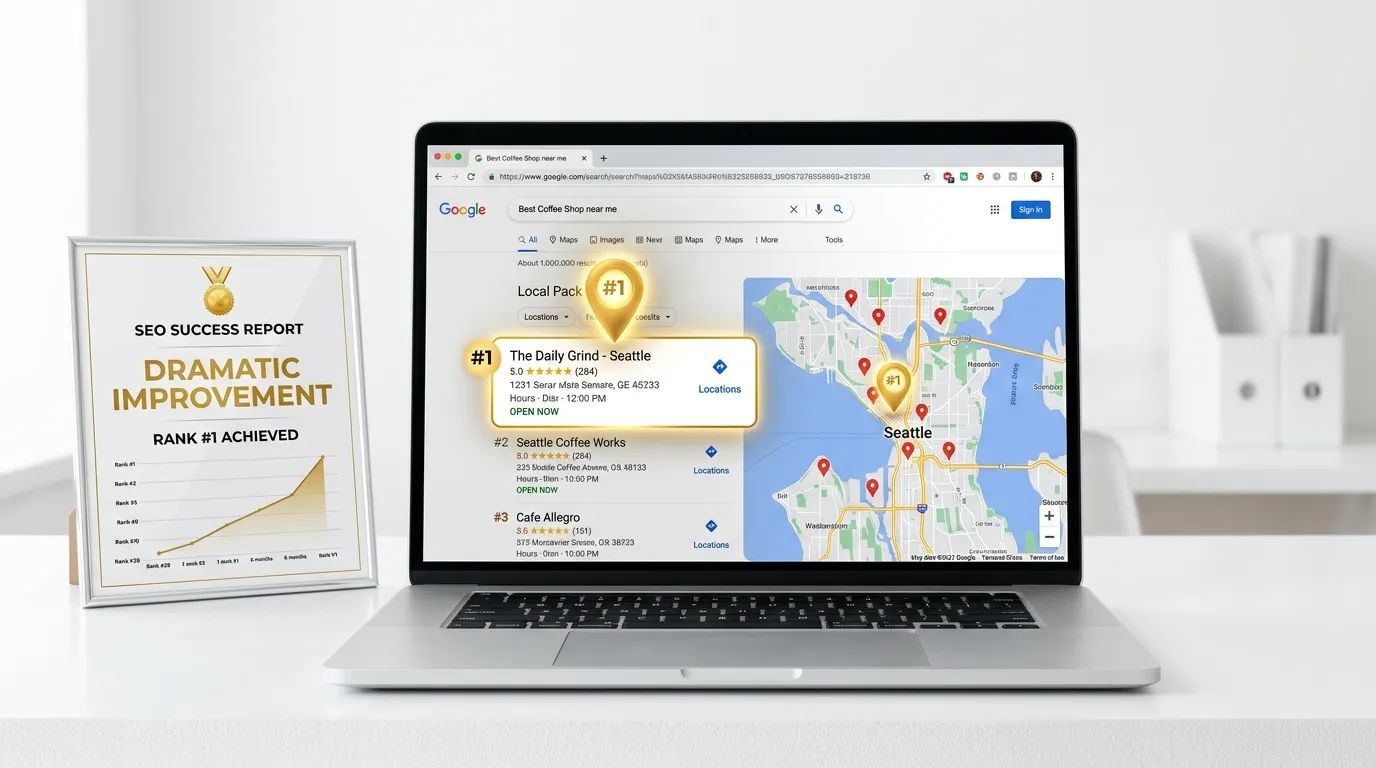
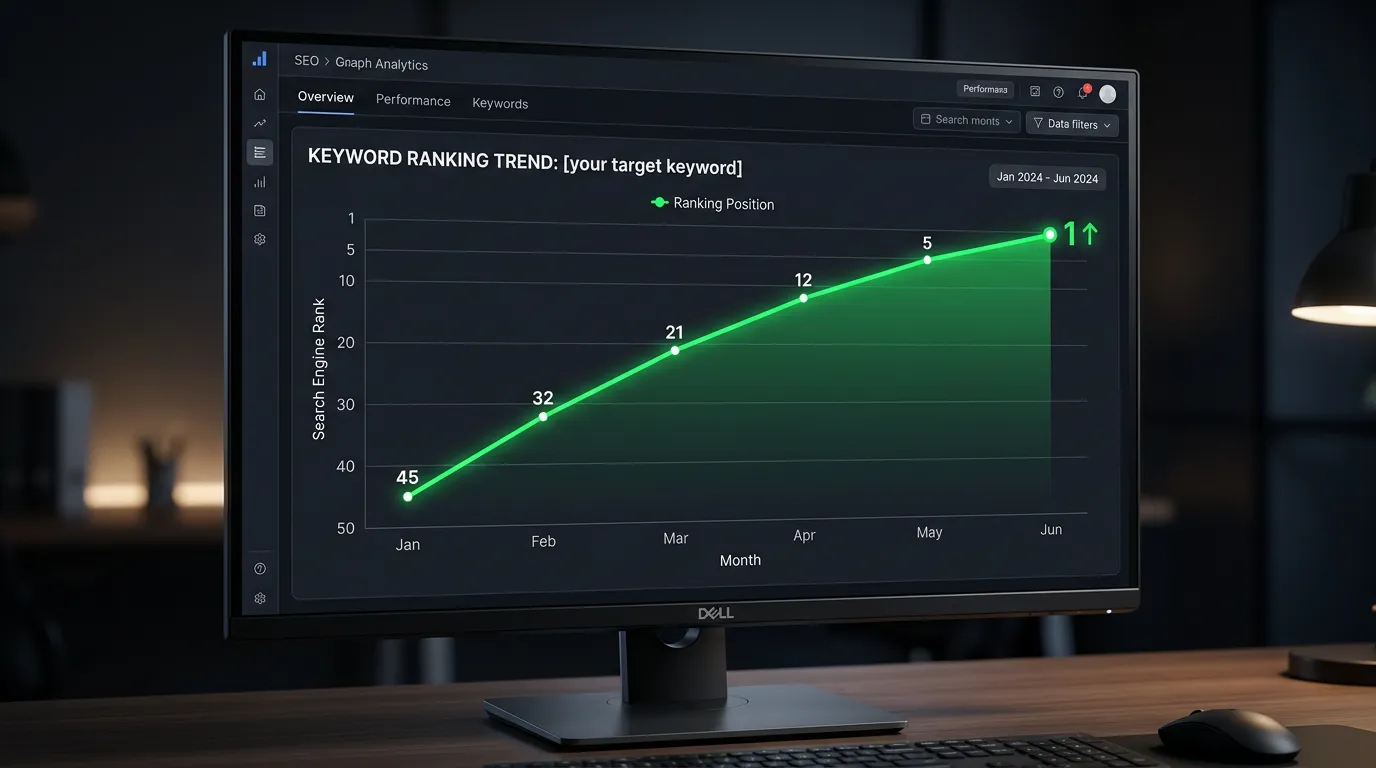
Any ranking example shown in this section is labelled illustrative when it is a teaching example rather than a record of real work. Verified client ranking data is published here with dates and scan settings as clients approve them.
What a Ranking Screenshot Actually Proves
A screenshot of a number one ranking proves that at some moment, on some device, for someone in some location, a result appeared in that position. That is the entire claim. It does not prove the position held for more than a minute, that anyone else sees it, that the keyword gets searched, or that the ranking produced a single phone call. It also does not prove the image was not edited, since changing text in a browser takes about four seconds and requires no special skill. Screenshots are not worthless as a communication tool. They make an abstract change feel concrete, and there is nothing wrong with showing one alongside real data. The problem is treating the picture as the evidence. Real ranking evidence has four properties a screenshot lacks: it is dated, it is repeated on a schedule so you can see a trend rather than a moment, it covers many locations rather than one, and it comes from a tool that recorded the measurement independently of whoever is telling you the story. If a ranking claim is missing those, it is a decoration.
Why Rankings Are Personal and Local
There is no single Google ranking for a local search. There are thousands of them happening at once. Local results are shaped heavily by where the searcher is standing, and the distance factor is strong enough that a business can sit in the top three map results at one intersection and be off the first page two miles away. Search history, the device, whether the person is signed in, and the exact wording of the query all shift what appears. This is why owners get confused when they search their own business name from the office and see themselves first, then hear from a customer across town who could not find them at all. Both experiences are accurate. This also means a promise of a number one ranking is meaningless even when it is made sincerely. Number one for whom, standing where, on what device, searching what phrase, on what day. The useful question is not whether you rank first. It is how much of your service area can see you in the map results, and whether that coverage is growing.
How Geogrid Scans Work
A geogrid scan solves the location problem by measuring from many places at once. The tool takes a keyword, a center point, and a grid of coordinates spread across your service area, then checks the local ranking for that keyword from each individual point. The output is a map covered in numbered squares, one per coordinate, showing where you rank if someone searches from that exact spot. Green squares mean top positions, red means far down or absent. What this gives you is coverage rather than a single position. You can see that you dominate near your address and fade five miles out, which tells you exactly where the next effort should go. Run the same scan monthly with identical settings and the change over time becomes visible and hard to argue with. The settings matter enormously, which is why we record them. A tight grid centered on your office over a small radius will look impressive and mean nothing. The same keyword on a wide grid covering your real service area tells the truth.
- Keyword, center point, grid size, and radius are recorded for every scan
- The same settings are reused every month so scans are comparable
- Coverage across the before and after service area matters more than one top position
- Scans run on a schedule, not only when the numbers look good
- Scan dates are shown on every report so trends can be checked
How Ranking Reports Get Inflated
None of the tricks below require lying outright, which is what makes them common. The most frequent one is keyword selection. An agency reports rankings for long, specific phrases almost nobody searches, and every one of them ranks well because there is no competition. The report is green and the phone is quiet. Another is shrinking the geogrid radius between the before and after scan, so the after picture is measured only where the business was always strong. Another is switching rank tracking tools midway, since different tools use different locations and refresh rates and can show several positions of difference on the same day. Another is reporting the best position recorded in a month rather than the average, which turns a single lucky check into a headline. Another is starting the comparison in the slowest month of your year. And the simplest of all is reporting only the keywords that improved and quietly dropping the ones that fell. Ask for the full keyword list every month, including the losers, and most of this disappears.
- Reporting easy long phrases nobody searches
- Shrinking the scan radius between the before and after
- Changing rank tracking tools mid engagement
- Showing the best position of the month instead of the average
- Starting the comparison in a seasonal low point
- Dropping keywords that lost ground from the report
How We Report Ranking Change
We run a geogrid scan before any optimization starts, so the baseline exists before we could have influenced it. The settings for that scan get written down: keyword set, center coordinate, grid dimensions, and radius. Every following scan uses those same settings, and the date sits on the report. The keyword list stays fixed for the engagement unless we agree together to add or retire something, and when we do, the change is noted in the report so a jump is never the result of a quiet swap. We report the whole list, including terms that dropped. We show average position across the grid, not the best square we found. And we always place the ranking data next to the call and form data, because ranking movement without call movement is a signal that something is wrong with the keyword choice or the landing page, and that is the more useful finding. Ranking data is a diagnostic in our reporting. It explains why the lead numbers did what they did. It is never presented as the result itself.
From Ranking to Revenue
The chain from a ranking to money has four links, and every one of them can break. First, the keyword has to be something people actually search with the intent to hire. Ranking first for a phrase with almost no volume produces nothing. Second, the listing or page has to earn the click against everything else on screen, which depends on your review count, your photos, and how the title reads. Third, the page has to convert. If someone lands on a slow page that buries the phone number, you paid for the visibility and gave the call to a competitor. Fourth, the call has to be answered well. A large share of calls to service businesses go unanswered during business hours, and no amount of ranking work fixes that. This is why our reports show the whole chain rather than the top of it. When rankings improve and calls do not, we look at links two, three, and four before we do more ranking work. Fixing a broken link usually produces more revenue than gaining two more positions.