Results
Industry Specific Results
Results that sound impressive in one trade are ordinary in another. This page explains what actually drives the differences and how we set targets you can trust.
Call (714) 823-3164 or ask a question. Clear recommendations, even if we never work together.
Marketing results vary widely by industry because search volume, job value, competition, and buying urgency all differ. A roofing company and a dental practice need different targets and different timelines. We set benchmarks from your own twelve month history first. Then we compare that against what the local competition shows publicly.
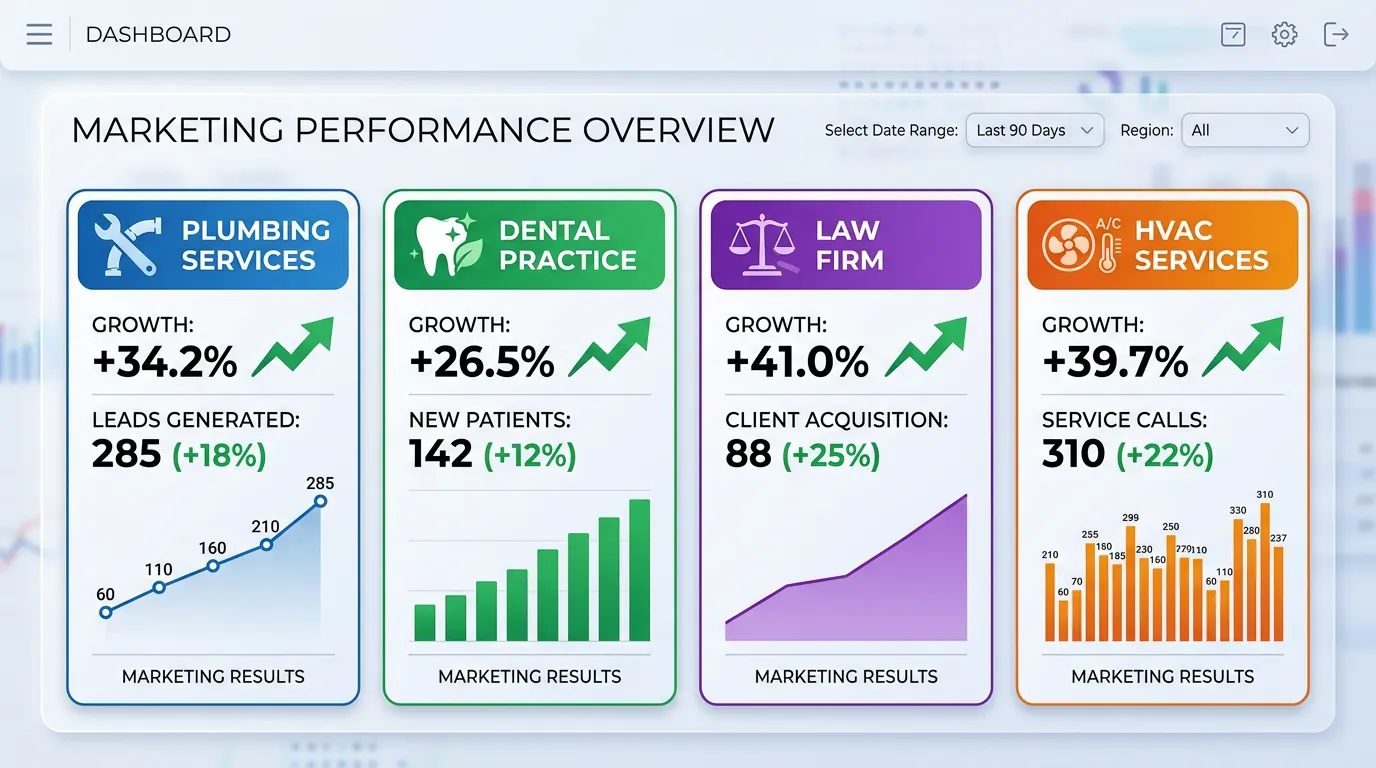
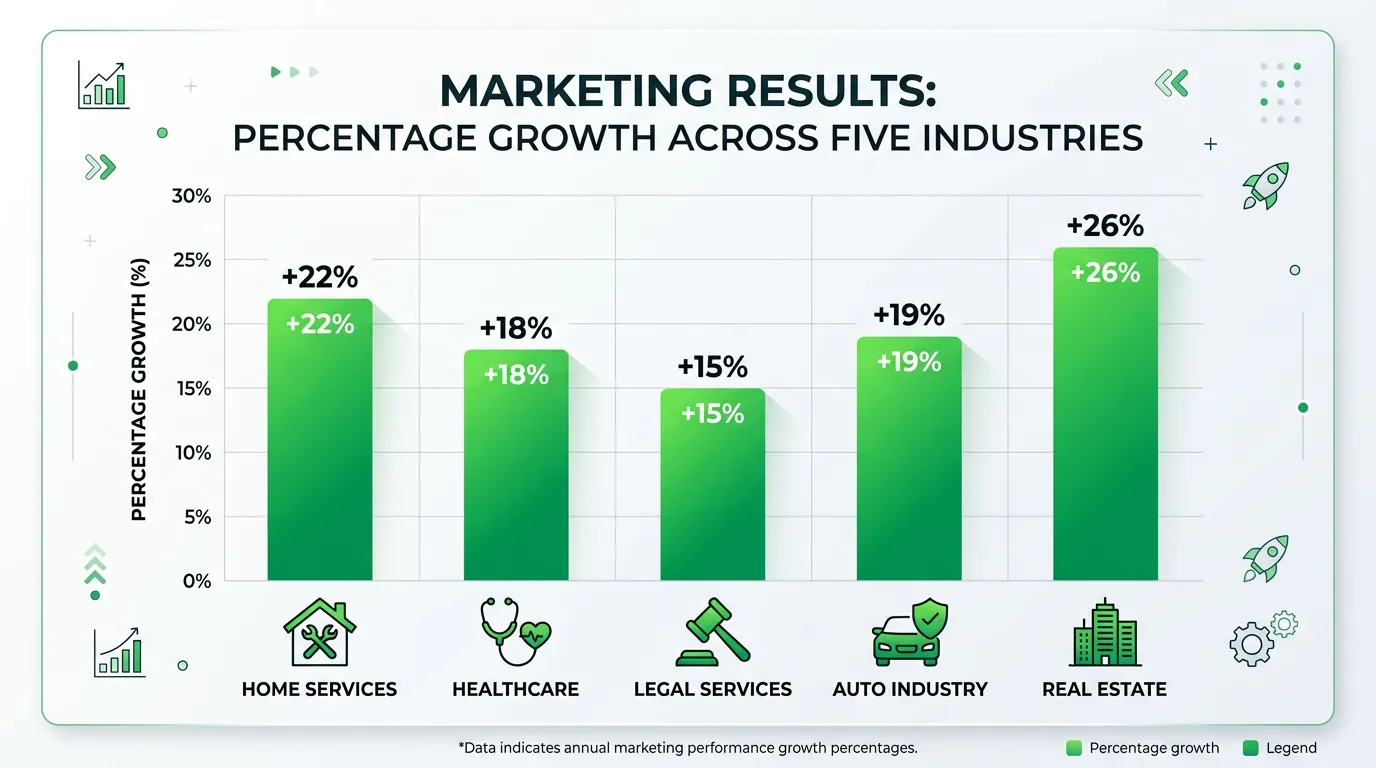
Any industry example shown in this section is labelled illustrative when it is a teaching example rather than a record of real work. Verified client results by industry are published here with dates and sources as clients approve them.
Why Results Differ by Industry
Four variables move almost everything. The first is search volume. An emergency plumbing term in a dense city gets searched constantly, while a specialized commercial service might get a few dozen searches a month in the whole region. Low volume is not a problem by itself, but it changes what good looks like, because six leads a month can be an excellent outcome when each job is worth twenty thousand dollars. The second is job value, which sets how much a lead can cost before the math stops working. The third is competition, meaning how many established businesses already have hundreds of reviews and a decade of site history in your area. The fourth is buying urgency. A burst pipe produces a call within minutes and almost no comparison shopping. A kitchen remodel involves three estimates over six weeks and a spouse who has opinions. Those two situations need different pages, different follow up, and completely different expectations about how quickly search work turns into revenue. Any target set without accounting for all four is a guess dressed up as a benchmark.
Seasonality Changes the Picture
Most service businesses have a seasonal shape, and ignoring it is how both agencies and owners fool themselves. Heating and cooling work spikes with the first heat wave and the first cold snap, and in Southern California those dates move around by weeks each year. Roofing follows rain. Pool service, landscaping, and pest control follow temperature. Tax and accounting work has an obvious spring peak. Dental and elective medical see a fourth quarter rush as insurance benefits expire. A report comparing this month to last month will show enormous swings that have nothing to do with the marketing at all, and it is easy to take credit for a season or blame the wrong cause for a decline. This is why our comparisons default to the same period last year rather than the previous month. It is also why the first ninety days of an engagement can look flat or even negative if you started at the top of your season. We would rather say that upfront than let you find out in month three and assume the industry specific work failed.
How We Set Benchmarks for Your Trade
We start with your own history, because it is the only data that already accounts for your prices, your market, your service area, and your reputation. If you have twelve months of call records, jobs booked, and revenue by month, that becomes the baseline and the seasonal shape we measure against. If you do not have that, and many owners do not, we build a baseline over the first sixty to ninety days while the foundation work is happening, which is one reason we set measurement up before optimization. Then we look outward at what your local competitors show publicly: their review counts and how fast they are growing, how much of the map grid they cover, how many pages they have for the services and cities you both want. That gap is the practical target, because those are the businesses standing between you and the searches you want. Published industry averages are the least useful input. They blend national markets, wildly different job values, and businesses nothing like yours, and a number from a national study rarely survives contact with one city in the Inland Empire.
- Your own twelve month history of calls, booked jobs, and revenue by month
- Your seasonal shape, so comparisons use the same period last year
- Review count and growth rate of the businesses ranking above you
- Map grid coverage held by current competitors in your service area
- Page and content depth of competitors for your priority services and cities
- Your average job value, which sets what a lead can reasonably cost
What Cross Industry Comparisons Hide
A cost per lead figure means nothing without the job value beside it. Forty dollars a lead is expensive for a business with an average ticket of one hundred and fifty dollars and extremely cheap for one that closes twelve thousand dollar jobs. The same problem applies to every headline number in marketing. A three hundred percent traffic increase says nothing without the starting number. A doubling of leads says nothing without the close rate, since a hundred bad leads can be worth less than ten good ones and cost your team more time. Timelines do not transfer either. A new dental practice in a suburb with four competitors can see map movement quickly, while a roofer in a metro area competing against companies with two thousand reviews might need a year to hold position. This is why we are careful with industry claims and why we will not publish a page saying we generate a given percentage lift for a given trade. The number would be true for someone and misleading for almost everyone reading it.
What We Will Publish by Industry
As clients approve publication, results will be organized by trade here, because a plumbing company wants to see plumbing outcomes and a dental practice wants to see dental ones. Each entry will carry the same requirements as any case study: named business, date range, source tools, budget band, what else changed, and what did not work. Grouped by industry, that becomes genuinely useful over time, since patterns start showing across several businesses in the same trade and one result stops carrying the whole argument. We will also publish the ranges honestly rather than only the best outcome in each category. If four home services clients ran the same play and one did much better than the others, showing all four is more useful than showing the winner, and it is the only version that helps you predict your own outcome. Until then, the most useful industry specific thing we can give you is an audit of your business against the specific competitors in your specific city, which is more relevant than any published average could ever be.
Questions to Ask About Industry Claims
Whenever an agency shows you a result from your industry, these questions separate the useful claims from the decorative ones. The pattern is always the same: ask for the context that turns a number into information. Most inflated industry claims fall apart at the first or second question, and the ones that survive all of them are worth taking seriously. Use these on us as well. If we ever put an industry statistic in front of you and cannot answer every item below about it, we have not done our job and you should push back. Pay attention to how the questions get received, not only to the answers. An agency with real documentation reaches for a file. An agency without one changes the subject, explains that the details are confidential, or moves quickly to a different client story. Neither reaction takes any marketing expertise to read correctly, which is what makes this list useful before you have signed anything.
- What city or market was this, and how does its competition compare to mine
- What was the average job value in that business
- What did a lead cost, and what did a booked job cost
- What was the starting point in absolute numbers, not a percentage
- What months did this cover, and where does that sit in the season
- How many other clients in this trade did you run the same play for
- How did the ones that underperformed do