Local SEO
Local Rank Tracking and Reporting
Measures rank from dozens of map coordinates, not one spot
- Timeline
- Setup takes 1 to 2 weeks
Call (714) 823-3164 or ask a question. Clear recommendations, even if we never work together.
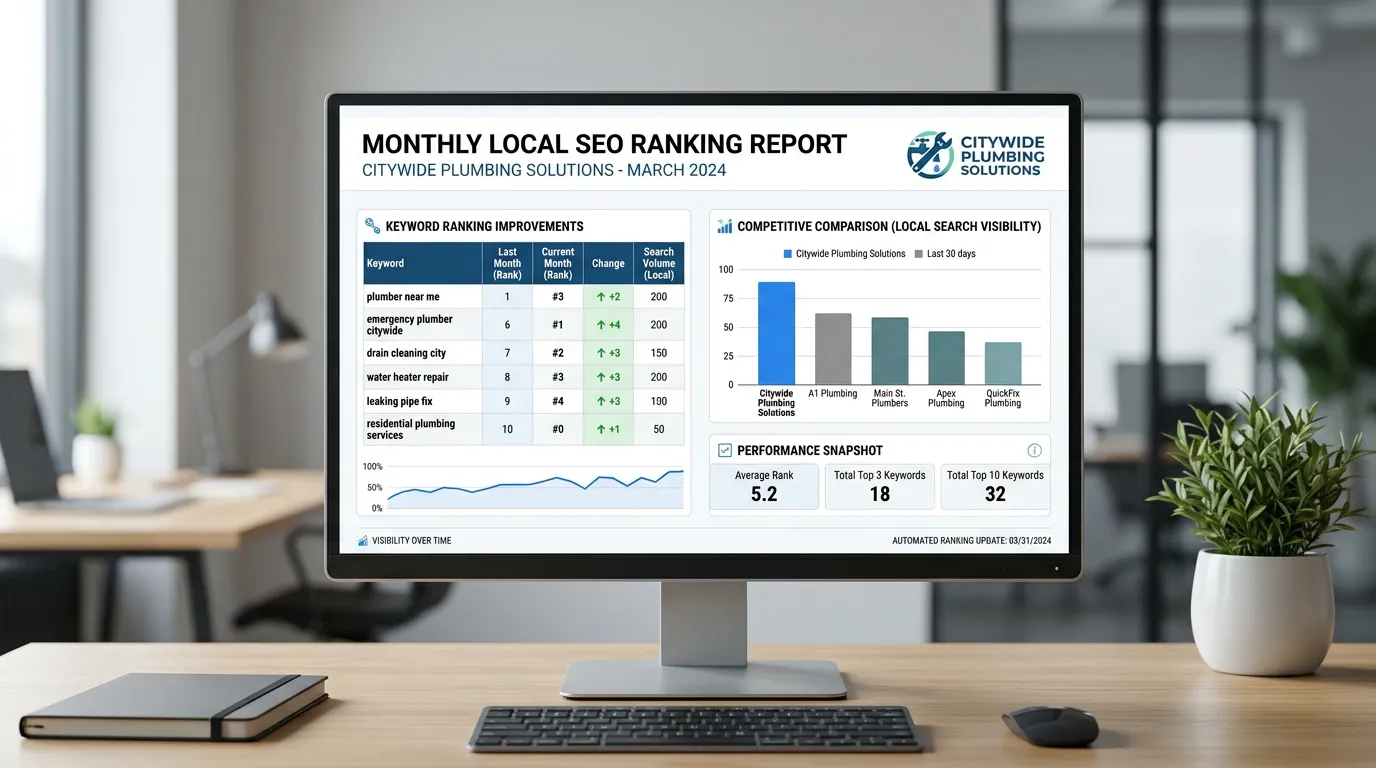
Local rank tracking measures where a business shows up in Google Maps and local search from many points across its service area. It uses geogrid scans built on real map coordinates, not one check from one spot. Position changes get tied to calls, direction requests, and form fills. You can then see what the local rank tracking work produced.
The problem
Rank reports are the most abused document in this industry. An agency sends a screenshot showing four number one rankings, and the owner has no idea those checks were run from an IP address two blocks from the shop for keywords nobody searches. Meanwhile the phone rings the same as last quarter. Without honest measurement you cannot tell whether the money is working, which means you either cancel something that was working or keep paying for something that never was.
What it is
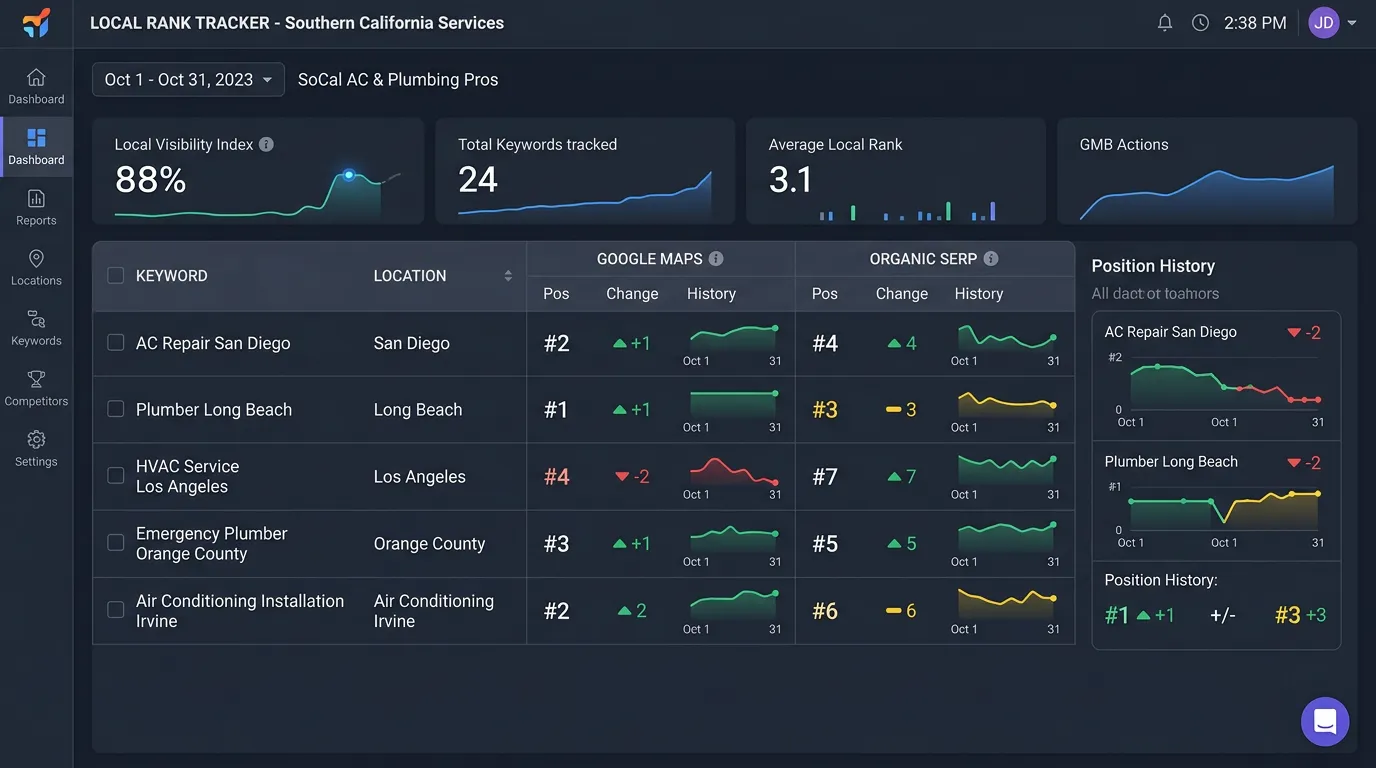
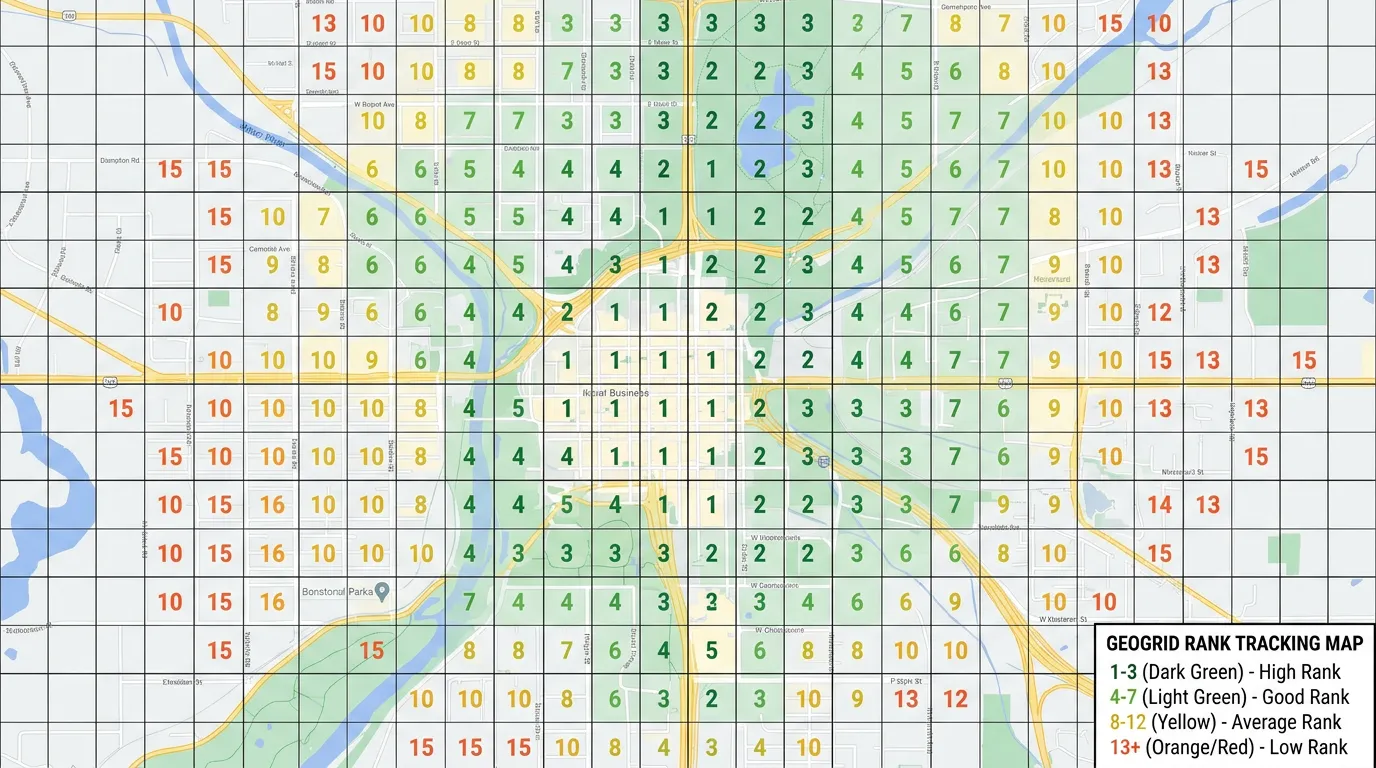
We set up a fixed keyword set of the terms that actually produce revenue. Then we scan those terms from a grid of coordinates spread across the areas you serve. Each scan produces a map showing your position at every point. It also gives you an average rank and a share of local voice score. That data sits next to your Google Business Profile numbers, your Search Console impressions and clicks, and your call tracking data. The point is not the ranking number. The point is answering one question. Are more people in the places you want to work finding you and calling you?
Signs you need this
- You cannot say whether last quarter's marketing spend did anything
- Your rank reports look great but the phone volume has not changed
- Nobody can tell you what location the rank checks were run from
- You get a PDF full of charts and no explanation of what to do next
- Leads come in and nobody records which channel they came from
What is included
- Keyword set of 20 to 40 revenue producing terms
- Geogrid scan configuration sized to your service area
- Monthly scan history with side by side comparison maps
- Share of local voice score trended over time
- Google Business Profile calls, direction requests, and website clicks
- Search Console query and landing page report
- Call tracking numbers with source attribution
- A one page monthly summary written in plain language
Our process
Define what gets measured
Week 1We pick the keyword set with you, weighted toward terms that produce paying jobs rather than terms with big search numbers. Then we set grid size and point spacing based on how far you actually travel for work.
Install the measurement stack
Week 1 to 2Local Falcon or BrightLocal for geogrids, Search Console and GA4 verified and connected, call tracking numbers placed with dynamic number insertion so your real number still shows on your profile and listings.
Baseline scan
Week 2We run the first full scan and save it as the reference point. Every future report compares against this, so nobody can move the goalposts later by quietly swapping keywords.
Monthly scan and readout
Ongoing, monthlySame keywords, same grid, same day of month. We send the comparison and a short written explanation of what moved, what did not, and what we think caused it.
Quarterly recalibration
Every 3 monthsEvery three months we review the keyword set against actual call transcripts and Search Console queries, retire terms that never convert, and add new ones customers are actually using.
Realistic timeline: Setup takes 1 to 2 weeks. First comparison report at day 30. Trends become reliable after three scans, so plan on 90 days before drawing conclusions from the data.
How to Read a Geogrid Without Fooling Yourself
A geogrid is a set of pins, each one colored by your position at that exact spot. Green in the middle and red at the edges is normal for every local business. What matters is the shape of the fade and how that shape changes month to month.
Watch the edges first. Say the center holds at two and the outer ring moves from twelve to seven. That is real progress, even though the average barely budged. Your reach grew. That is exactly what review and link work is supposed to do.
Be careful with the average rank number on its own. One keyword falling apart can drag it down while everything else improves. Open the per keyword view before you react to it. Compare the same month last year when you have the history, because local demand swings hard by season. A flat July can still be a better July than the last one.
Grid Size by How Far You Actually Travel
Grid settings are not a detail. Too tight and you never see the edge of your reach. Too wide and you pay for pins in towns you would never drive to.
| Your service area | Grid | Point spacing | What it shows you |
|---|---|---|---|
| One city, tight radius | 5 by 5 | About 1 mile | Where you fade inside your own town |
| Home city plus neighbors | 7 by 7 | 1.5 to 2 miles | The real edge of your reach |
| County wide trade | 9 by 9 | 3 to 5 miles | Which towns are dead zones |
| Two or more locations | One grid each | Sized per location | Where the two locations overlap |
Bigger grids cost more per scan. Pick the smallest grid that still covers where your jobs come from.
What Belongs in a Monthly Report
If your report is missing three of these, you cannot tell whether the money is working.
The same keywords as last month
Swaps hide bad news
The same grid and same day
Timing shifts results
Average rank and the map
One number hides a lot
Calls split by source
Answered and missed
Direction requests
A strong buying signal
Search Console clicks
Organic sits under Maps
A plain sentence saying why
Written by a person
One action for next month
Or nobody does anything
A rank report that never shows a drop is not a report. It is a sales document.
Two Questions About the Numbers
Why did my rankings move when we changed nothing?
What counts as a real drop worth a phone call?