Web Design and Development
Website Speed and Core Web Vitals
Three measures: loading, responsiveness, and layout stability
- Timeline
- Three to five weeks of work on a typical site
Call (714) 823-3164 or ask a question. Clear recommendations, even if we never work together.
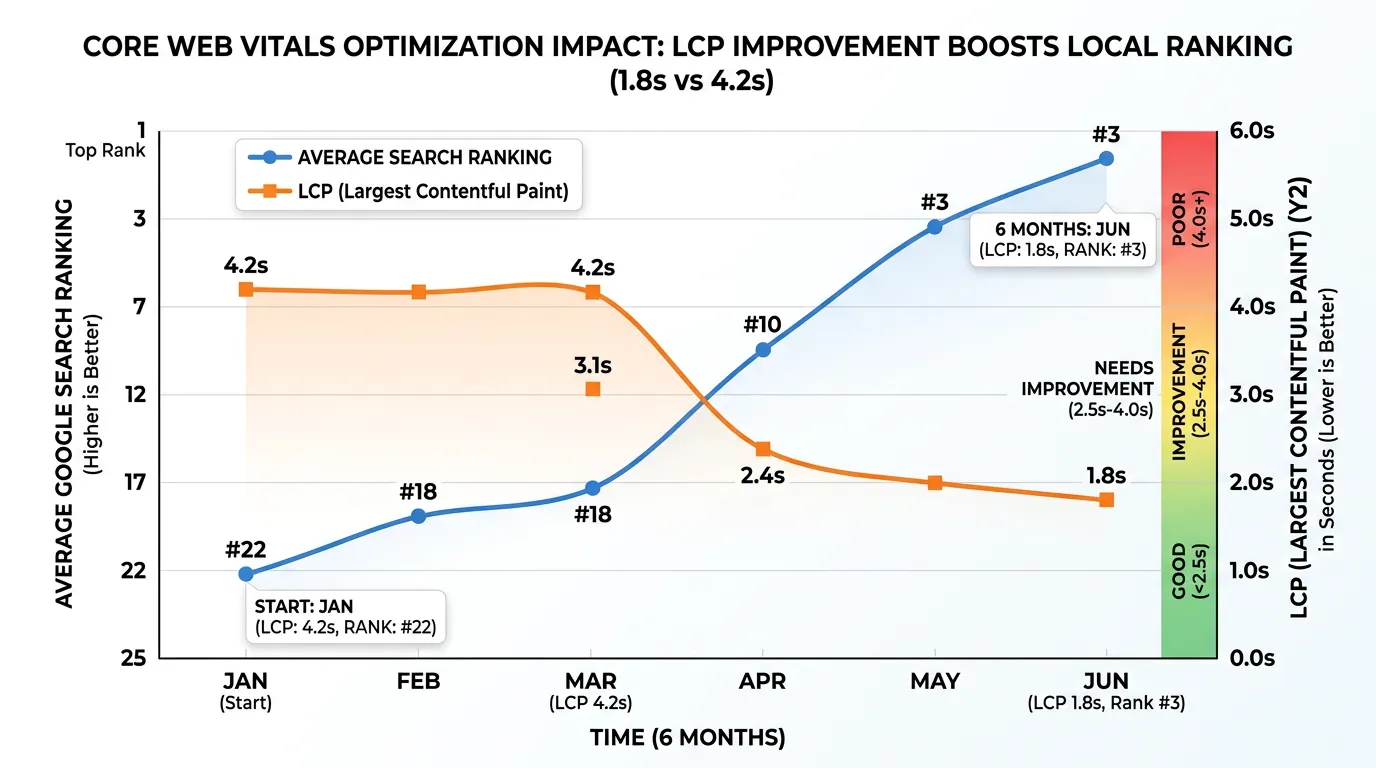
Core Web Vitals are Google's three measures of page experience. Largest Contentful Paint covers loading. Interaction to Next Paint covers how fast a page responds. Cumulative Layout Shift covers whether the page jumps around. Speed work aims to pass all three on real phone traffic, so visitors do not leave before the page loads.
The problem
Slow sites bleed visitors before anyone sees the design. A page that takes six seconds on a phone loses a large share of visitors who never scroll at all, and the ones who stay are already annoyed. The usual culprits are boring: a 4 megabyte hero image uploaded straight from a camera, four different Google Fonts loading, a chat widget, a review widget, two tracking pixels, and a page builder that ships 900 kilobytes of JavaScript to render a text section. Owners test on their office fiber connection, see it load fine, and conclude the site is fast.
What it is
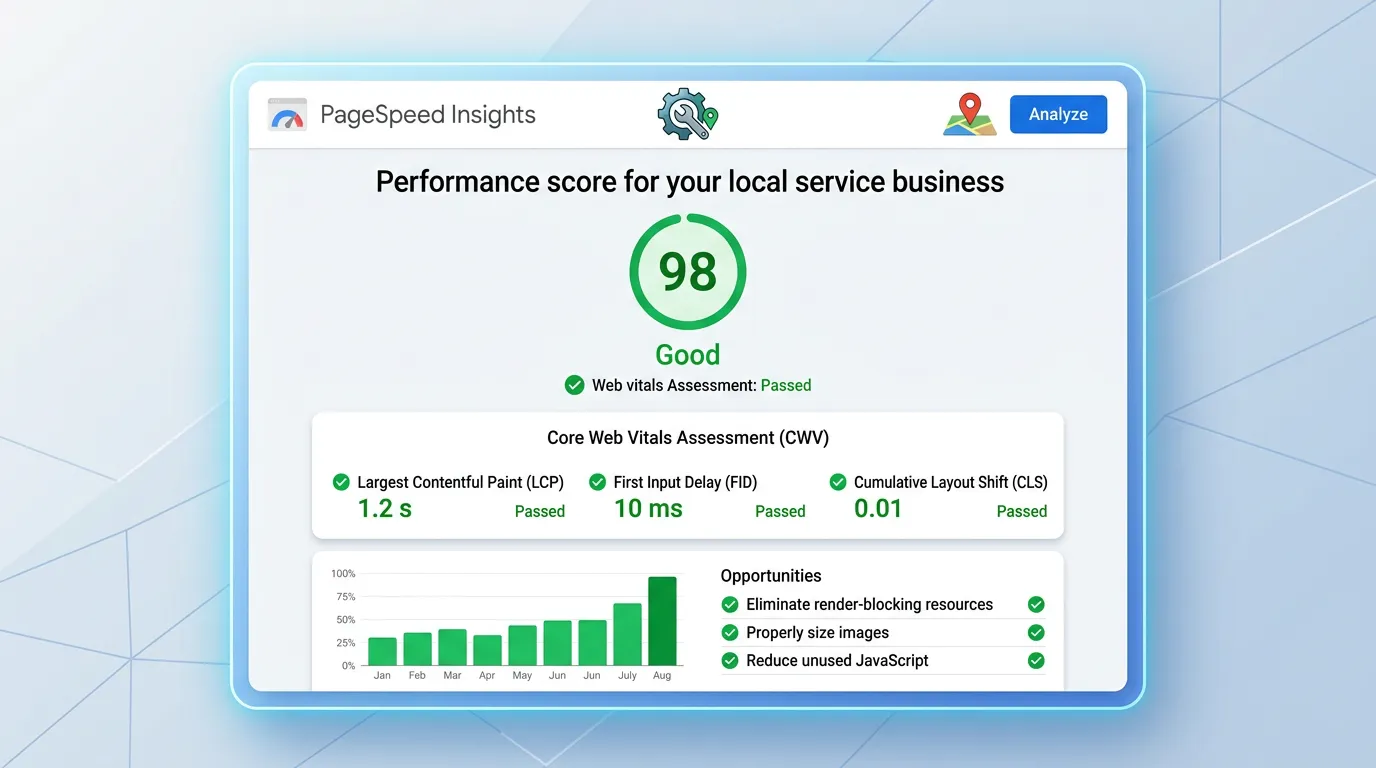
Speed work targets three specific measures. Largest Contentful Paint should land under 2.5 seconds. The usual fixes are compressing the hero image, serving modern formats, preloading it, and turning on server caching. Interaction to Next Paint should stay under 200 milliseconds. That one usually comes down to cutting or deferring JavaScript, especially third party widgets. Cumulative Layout Shift should stay under 0.1. The usual fix is setting a width and height on images, and reserving space for ads, banners, and embeds. We measure against field data from real users in Search Console. A lab score from one test run is not enough.
Signs you need this
- Search Console shows URLs failing Core Web Vitals on mobile
- Your site takes more than four seconds to show anything on a phone
- Content jumps around while the page is loading
- Buttons feel unresponsive for a moment after tapping
- Your hero image file is larger than one megabyte
What is included
- Field data baseline from Search Console Core Web Vitals and the Chrome UX Report
- Image compression with WebP or AVIF conversion and correct sizing per device
- Hero image preloading and lazy loading for everything below the fold
- Font loading strategy using font display swap and self hosted files where possible
- Third party script audit with a load cost figure for each widget
- Deferred or removed JavaScript for anything not needed for first paint
- Server side caching and a content delivery network configured
- Explicit width and height on images and reserved space for embeds
- Before and after report using both lab scores and real user field data
Our process
Field Data Baseline
Days 1 to 3We record what real visitors experience using Search Console and the Chrome UX Report, broken out by phone and desktop. A single PageSpeed Insights run on one connection is not a baseline, it is a snapshot.
Weight Audit
Days 3 to 7We list every request the page makes and what it weighs, then rank fixes by kilobytes saved per hour of work. Usually two or three items account for most of the problem, and it is almost always images and third party scripts.
Image and Font Work
Week 2 to 3Images get compressed, converted to modern formats, sized per device, and lazy loaded below the fold. Fonts get trimmed to two families with swap behavior so text is readable while they load.
Script and Caching Work
Week 3 to 4We defer or remove nonessential JavaScript, question every third party widget by its load cost, then enable server caching and a CDN. Chat and review widgets are the usual offenders and often get delayed until after first interaction.
Re measure in the Field
Days 28 to 35 after changesLab scores move immediately. Field data updates on a rolling 28 day window, so the real verdict arrives about a month after the core web vitals work ships. We report both so you know which number is which.
Realistic timeline: Three to five weeks of work on a typical site. Lab scores improve immediately. Search Console field data reflects the change after a rolling 28 day window.
Where the Seconds Actually Go
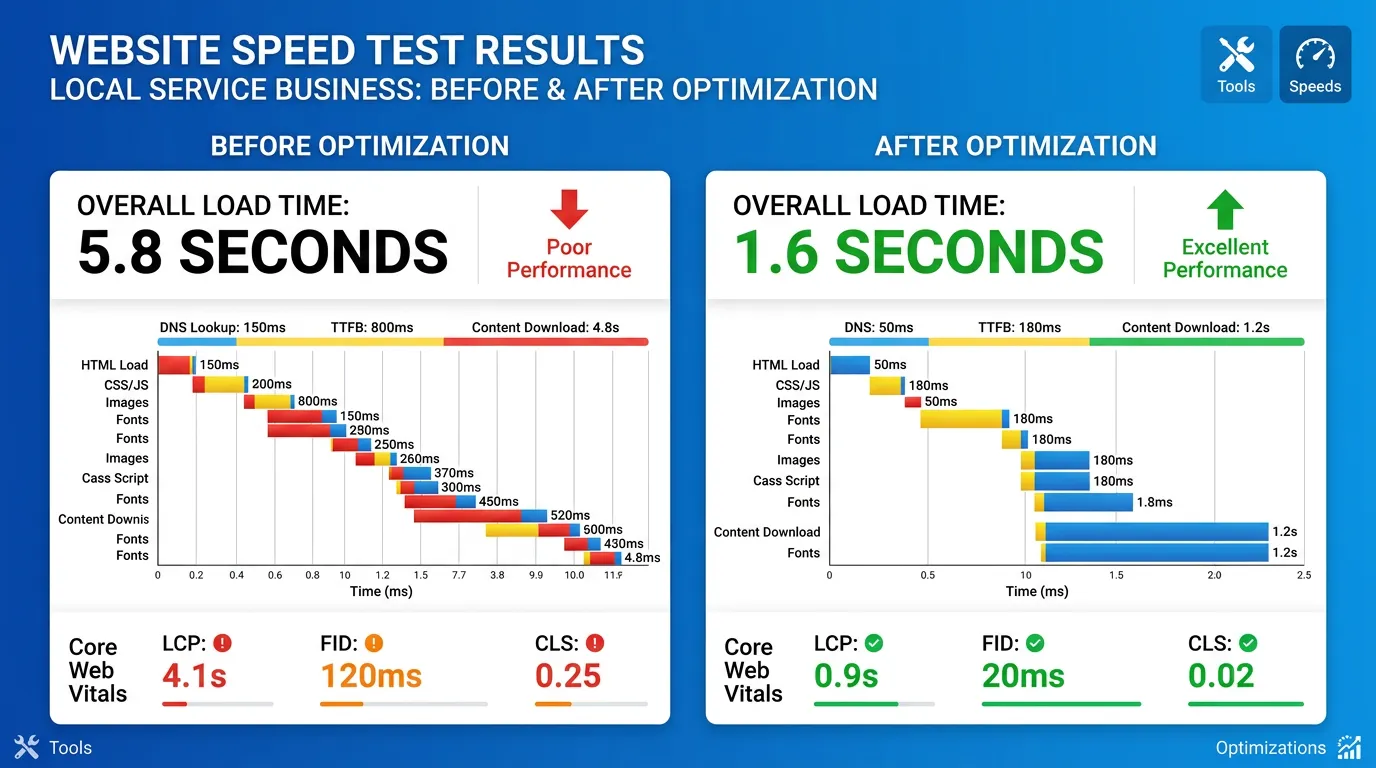
Slowness is rarely spread evenly across a page. On most local service sites, three or four items cause almost all of the delay. Here is what we weigh first, and what each one should be.
| What loads | Typical size on a slow site | What it should be | Usual fix |
|---|---|---|---|
| Hero image | 2 to 5 MB straight from a camera | Under 200 KB | Resize, convert to WebP, preload it |
| Photo gallery | Twenty full size images at once | Under 150 KB each | Compress, then load on scroll |
| Web fonts | Four families and eight weights | Two families, three weights | Trim weights and self host |
| Page builder scripts | 600 to 900 KB per page | Under 200 KB | Drop unused modules or rebuild the template |
| Chat or review widget | 300 to 800 KB each | Nothing until first scroll | Delay loading until a tap or scroll |
| Video background | 8 MB or more on a phone | A still image on phones | Serve a poster image on small screens |
Work in size order. The hero image alone often moves Largest Contentful Paint by more than a full second.
The Wait Nobody Measures: Server Response
Before a browser can draw anything, your server has to answer. That wait is called Time to First Byte, and it happens before a single image loads.
Aim for under 800 milliseconds. Cheap shared hosting often takes 1.5 to 3 seconds on a Monday morning, when every other site on that machine is busy too.
No amount of image work fixes that. If your server needs two seconds to answer, your Largest Contentful Paint can never beat two seconds.
You can check it yourself. Run PageSpeed Insights and read the server response time line. If that number is high, the answer is caching or a better host, not smaller pictures.
Check Your Own Site in Twenty Minutes
You do not need a tool subscription to know whether you have a problem. Run this on your phone, on cell data, not on the office wifi.
Open your homepage with wifi turned off
Count the seconds until the headline appears
Check the file size of your hero image
Anything over 400 KB needs work
Count the third party tools on the page
Chat, reviews, maps, booking, pixels
Open Core Web Vitals in Search Console
Read the mobile tab, not desktop
Scroll fast and watch for jumping content
Movement after load is layout shift
Tap a button the second the page appears
A pause points at heavy scripts
Load the same page a second time
No improvement means caching is off
Test a service page, not only the homepage
Interior pages are often heavier
Questions That Come Up Mid Project
Does a CDN help a business that serves one county?
Should I use WebP or AVIF for photos?
My score jumped from 40 to 90 but Search Console has not moved. Why?