Conversion Rate Optimization
A/B and Multivariate Testing
Settles arguments with data instead of who has the strongest opinion
- Timeline
- A single test typically takes 4 to 8 weeks from hypothesis to conclusion, with 2 to 6 of those weeks in market
Call (714) 823-3164 or ask a question. Clear recommendations, even if we never work together.
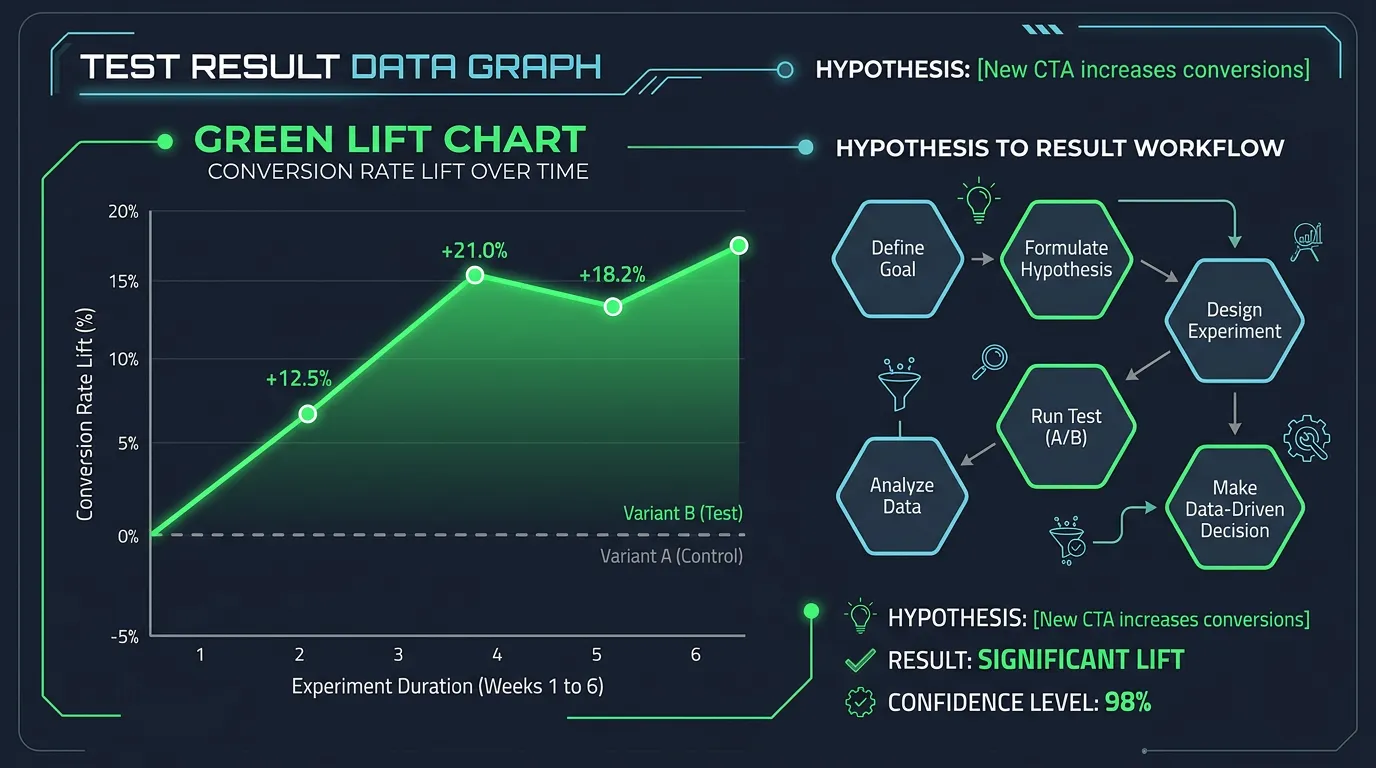
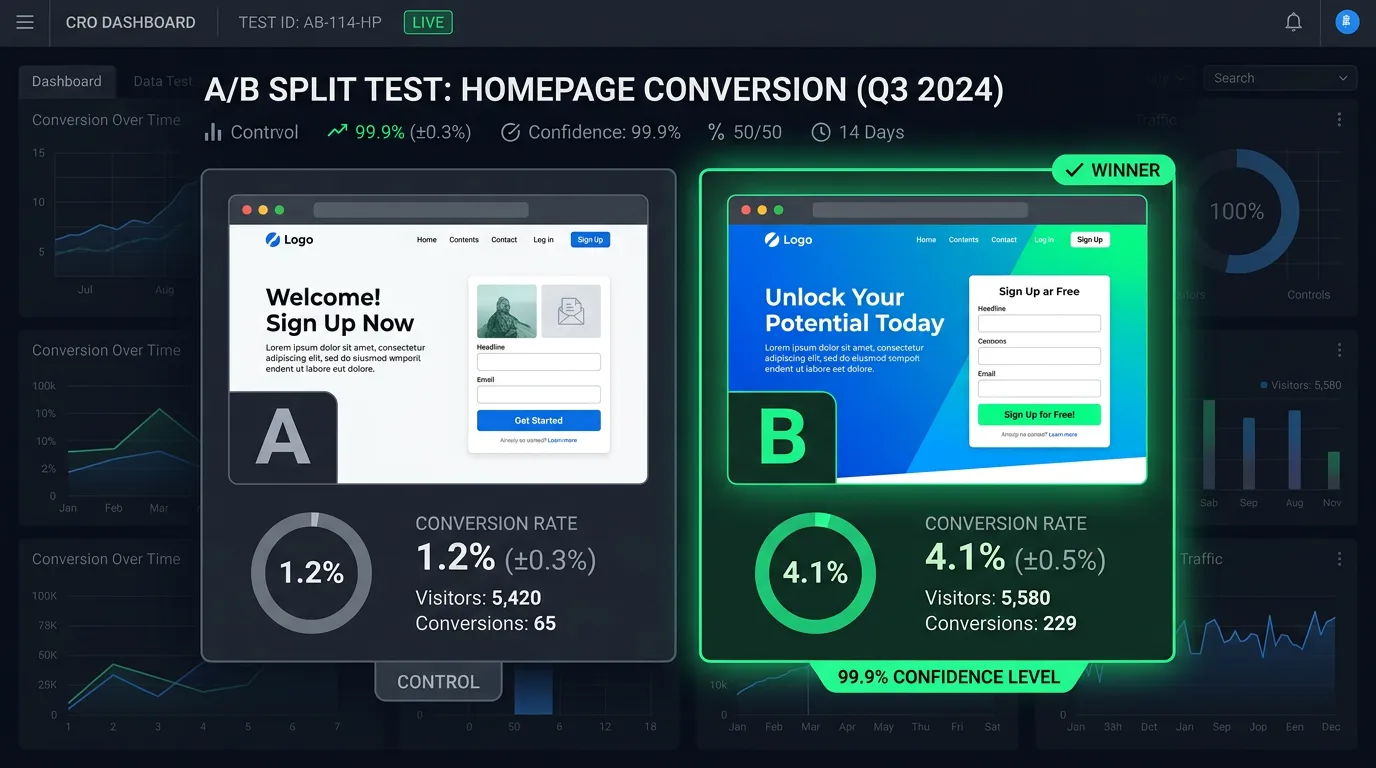
A/B testing shows two versions of a page to visitors at random, then measures which one brings more conversions. Multivariate testing changes several parts of a page at once to measure their combined effect. Both need enough traffic and a sample size set before the test starts. That is what makes the result worth trusting.
Jump to a section
The problem
A/b testing is where most conversion programs go wrong, and the failures look like successes. A test runs for five days, one version is ahead by 20 percent, everyone celebrates and ships it. Then leads go back to normal because the sample was too small and the difference was noise. Or a company runs twelve tests at once on a site with 800 monthly sessions and never gets a conclusive result from any of them. Or the test tool adds a flicker on load that changes visitor behavior by itself. Bad a/b testing is worse than no testing, because it produces confident wrong conclusions.
What it is
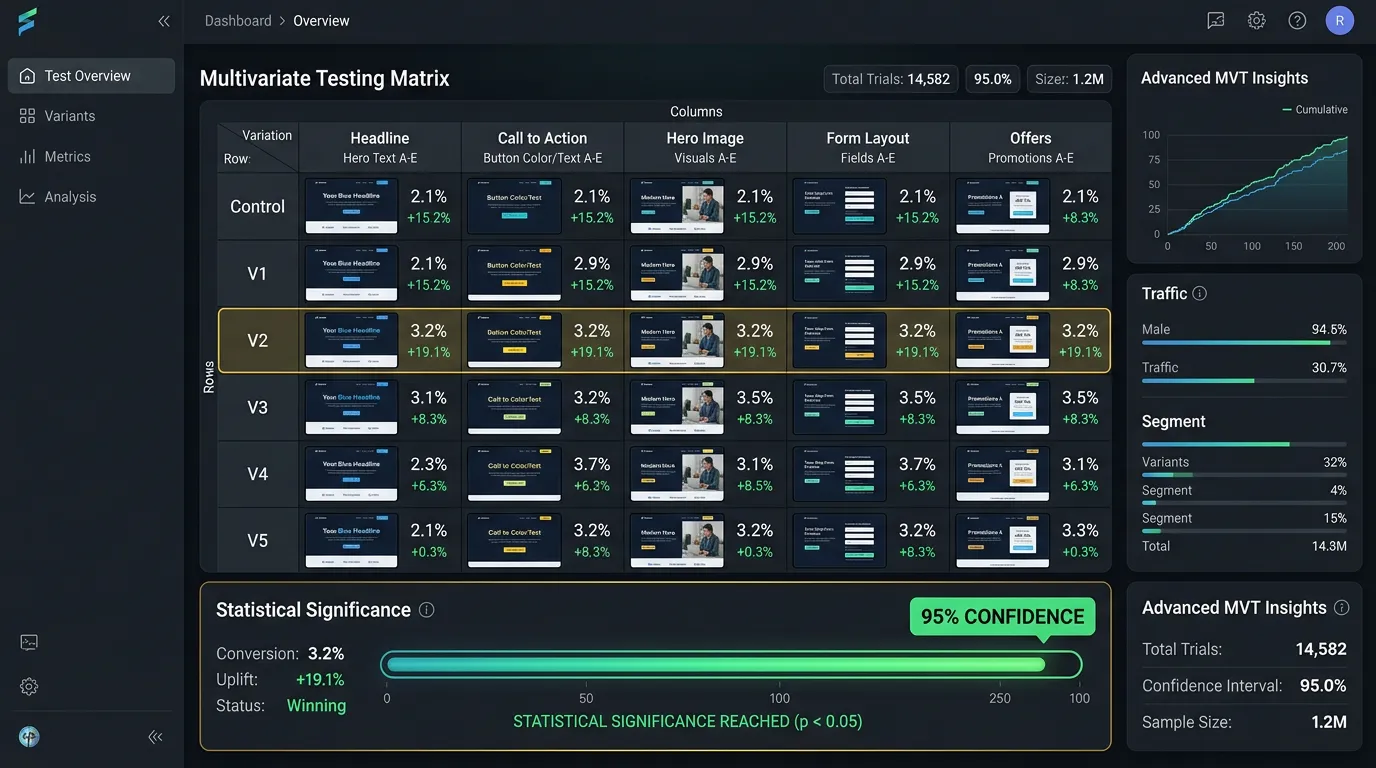
A disciplined test program starts with one idea backed by evidence, not a list of things to try. Before launch we work out the sample size the test needs. That math comes from your current conversion rate and the smallest lift worth finding, and it tells us honestly whether the test can run on your traffic at all. Tests get built in VWO, Optimizely, or a server side split, depending on your setup. Each one includes anti flicker handling so the variant does not flash on load. Tests run for at least two full weeks, so a whole weekly cycle is counted. They also run to the planned sample size, no matter how good the interim numbers look. We only recommend multivariate testing when traffic truly supports it. Testing four elements in combination needs many times the sample of a simple A/B test. Every result gets written down, including the losses, which often teach you more.
Signs you need this
- Your team argues about page changes with no way to settle it
- You have made changes and cannot tell whether they helped
- Paid traffic volume is high enough to test but nobody is testing
- A previous agency claimed big test wins that never showed in revenue
- You are about to make an expensive change and want proof first
What is included
- Hypothesis backlog built from audit evidence, ranked by expected value
- Sample size and duration calculation before every test
- Test build and QA across browsers and devices
- Anti flicker implementation so variants do not flash on load
- Goal and segment configuration for calls, forms, and chat
- Interim monitoring for breakage without peeking at significance
- Result analysis with confidence intervals, not just a winner label
- Documented test log recording every win, loss, and inconclusive result
Our process
Hypothesis selection
Week 1We pull from the audit backlog and pick tests where the expected effect is large enough to detect on your traffic. Small refinements get skipped in favor of changes big enough to actually measure.
Power calculation
Week 1Using your baseline conversion rate and traffic, we calculate how long the test must run to detect the lift we care about. If the answer is eleven months, we do not run the test and say so.
Build and QA
Week 2The variant gets built and checked on iOS Safari, Android Chrome, and desktop, with tracking verified end to end. A broken variant on one browser silently poisons the whole result.
Run to sample size
Week 3 to 7The test runs for at least two full weeks and until it hits the planned sample. We monitor for technical breakage during the run but do not call a winner early based on interim numbers.
Analyze and document
Week 7 to 8Results get reported with the confidence interval and segment breakdowns for mobile versus desktop. Winners get shipped permanently, losers get reverted, and both go in the test log with what we learned.
Realistic timeline: A single test typically takes 4 to 8 weeks from hypothesis to conclusion, with 2 to 6 of those weeks in market. Sites with lower traffic may only support four to six conclusive tests per year. High traffic sites can run continuously.
The life of a single test
A test is not a switch you flip. This is the order we work in, and roughly how long each part takes on a normal service site.
Most of the calendar is waiting. Rushing the wait is what breaks the result.
How much traffic a test actually needs
These are rough numbers from the standard sample size formula at 95 percent confidence and 80 percent power. The count is visitors per version, so double it for the whole test.
| Current rate | Lift you want to detect | Visitors per version | At 4,000 visits a month |
|---|---|---|---|
| 2 percent | 20 percent relative | About 19,600 | No, about 10 months |
| 2 percent | 50 percent relative | About 3,100 | Yes, about 7 weeks |
| 3 percent | 20 percent relative | About 12,900 | No, about 6 months |
| 5 percent | 20 percent relative | About 7,600 | No, about 4 months |
| 5 percent | 50 percent relative | About 1,200 | Yes, about 3 weeks |
| 8 percent | 20 percent relative | About 4,600 | Tight, about 10 weeks |
The lesson is simple. On a small site, only bold changes are worth testing at all.
Test habits that hold up, and habits that fool you
Most bad results come from process, not from the idea being tested. These are the rules we hold to.
Do this
- Write the hypothesis and the sample size before anyone builds anything.
- Run whole weeks, so Monday and Saturday both count.
- Check the variant on an older Android phone, not just your laptop.
- Split the result by device before deciding, since mobile and desktop often disagree.
- Log every test, including the ones that went nowhere.
Not this
- Do not stop a test the day it looks like a winner.
- Do not run two tests on the same page at the same time.
- Do not test button shades on a site with 40 leads a month.
- Do not edit the page mid test, even to fix a typo.
- Do not report a result without the confidence range next to it.
What to do when your traffic is too small to test
Most local service sites cannot run a proper A/B test. Pretending otherwise wastes months. That is not a reason to stop improving, it is a reason to change the method.
We use sequential changes instead. One change ships, then we hold it for a full month and compare against the three months before plus the same month last year. Season gets checked first, since a July jump in air conditioning calls proves nothing about your new headline.
Alongside that we lean on evidence that does not need volume: recordings, call notes, and watching five people use the page. It is weaker proof, and we say so in the report rather than dressing a guess up as a result.
Testing questions worth settling early
Can I still test with Google Optimize?
Does a testing tool slow my site down?
What counts as a change big enough to test?